How to Track Your Stock Portfolio for Free (Global)
Most investors can tell you what their shares are worth today. Far fewer can answer the questions that matter:
- What return have I actually made, in dollars and in percentage terms?
- How much of it came from the shares, and how much from the exchange rate?
- Am I beating the S&P500, or would an index fund have done better?
If you hold shares across the ASX, the US and other markets, your broker statements rarely answer these in one place. This guide shows you how to track your share portfolio properly, step by step, using the free TinyTaikun Portfolio Tracker. You’ll learn what each number means, how it’s calculated, and how to use it to make better decisions.
Try it as you read: open the free portfolio tracker. You can start as a guest, without signing up.
What a good portfolio tracker should tell you
Before you track your share portfolio with any tool, decide what you need to know. A useful share portfolio tracker answers six questions:
- What have I really made? Total return on what you invested, and the yearly rate (CAGR).
- Where did it come from? Share-price moves versus currency moves, especially for overseas shares.
- What have I locked in? Realised gains from sales, separate from paper (unrealised) gains.
- Am I beating the market? Your actual results against the same money in an index.
- How risky is my mix? Concentration, sectors, countries, currencies and company size.
- What income am I getting? Dividends received, dividends expected, and when results are due.
The TinyTaikun tracker, a free share portfolio tracker made for Australian and global investors, covers all six, for stocks, ETFs and listed funds on the ASX, NYSE, Nasdaq, London, European exchanges, Toronto, Tokyo, Hong Kong, Singapore and more. It’s free, with no paid tier.
Getting started in under a minute
You have two ways to start:
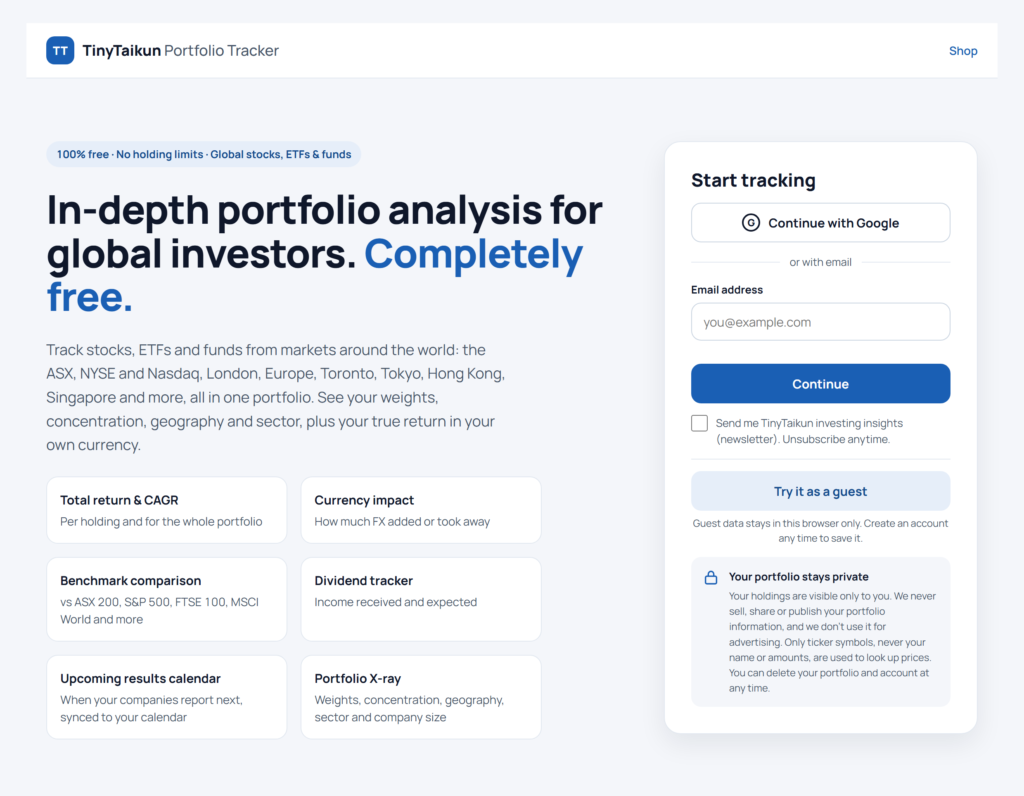
- Try it as a guest. Your portfolio is saved in your own browser only. Nothing is sent to us except ticker symbols, which are needed to look up prices.
- Create a free account with Google or your email. Your portfolio is saved securely and you can use it on any device. If you started as a guest, your holdings move into your account automatically.
Want to look around first? Choose Explore the example dashboard to see a full, working sample portfolio. All the screenshots in this guide come from that example.
Privacy in plain English: your holdings are visible only to you. They’re never sold, shared or used for advertising, and you can delete your portfolio and account at any time.
Step 1: Add your holdings (and anything you’ve sold)
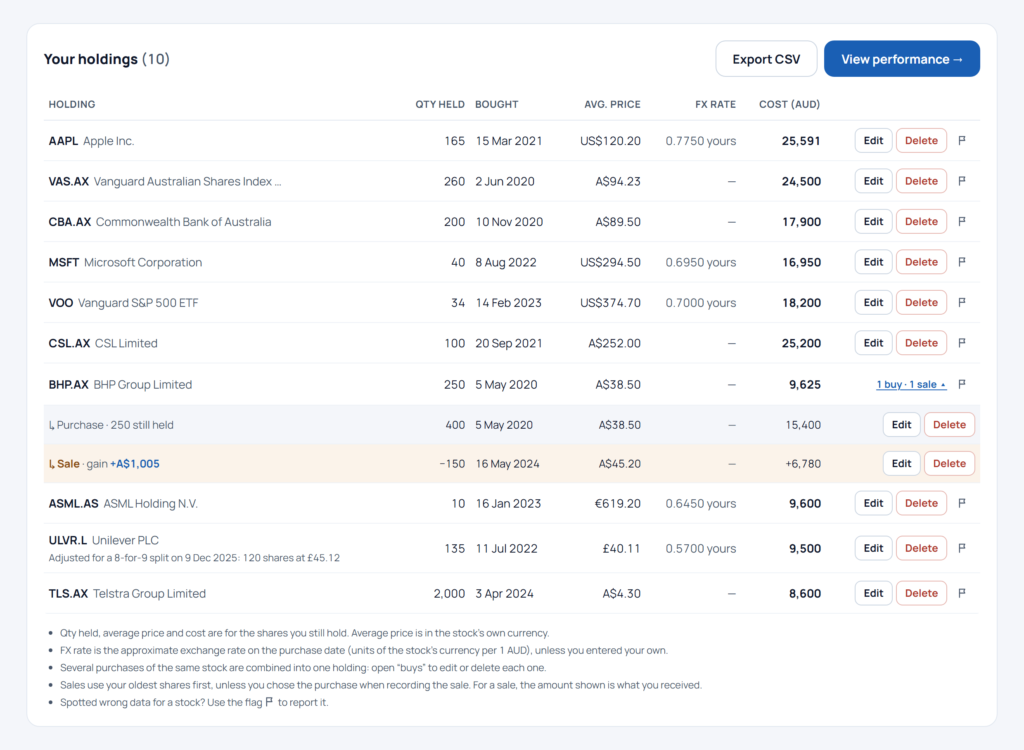
Open the Edit holdings tab. There are two ways to add your portfolio.
Type in a purchase
- Search for the stock, ETF or fund by name or ticker (for example CBA.AX, AAPL or VOD.L).
- Enter the quantity, purchase date and price per share in the stock’s own currency.
- For overseas shares, choose how to work out the cost in Australian dollars:
- the approximate exchange rate on the purchase date (quick and close enough for most people), or<ul>
- the exact A$ price you paid, from your broker statement.
The tracker checks your figures before saving. If a London price looks like it was entered in pence (8,470 instead of £84.70), or an A$ figure looks like a total rather than a price per share, it says so and offers the corrected number.
Bought the same stock more than once? Add each purchase. They’re combined into one holding, with the average price worked out for you.
Record a sale
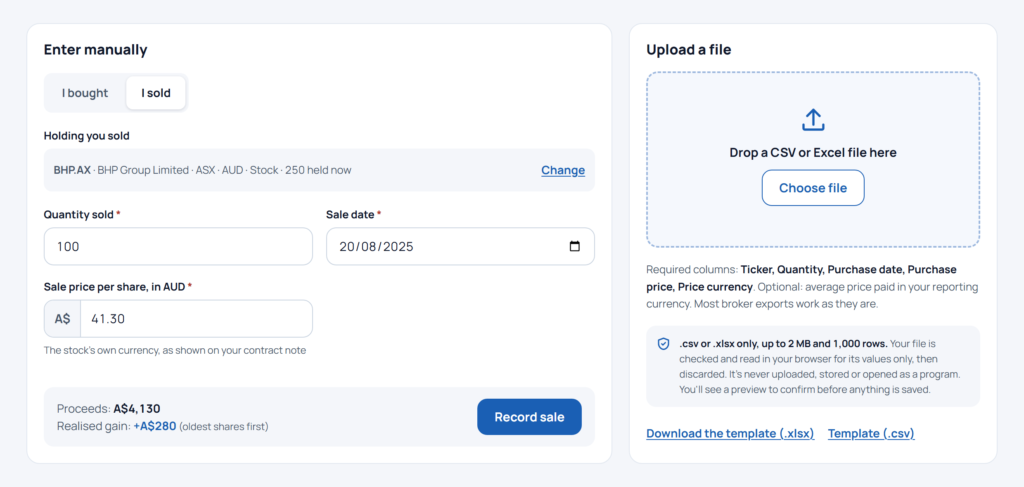
Switch to I sold, pick the holding, and enter the quantity, sale date and sale price. Before you save, you see what you received in A$ and your realised gain or loss.
By default, sales use your oldest shares first. If you sold a specific parcel, open Which shares did you sell? and choose the purchase it came from. The realised gain is then worked out against that purchase’s price.
Or upload a file from your broker
Prefer not to type? Upload a CSV or Excel file. Most broker exports work as they are, and there’s a template if you need one.
- Your file is read in your browser and checked row by row.
- You see a preview before anything is saved.
- Rows with problems (an unknown ticker, a date in the future, a sale of more shares than you held) are marked so you can fix them.
- Files can include sales (a Buy or sell column) and your own exchange rate.
Step 2: See your true return
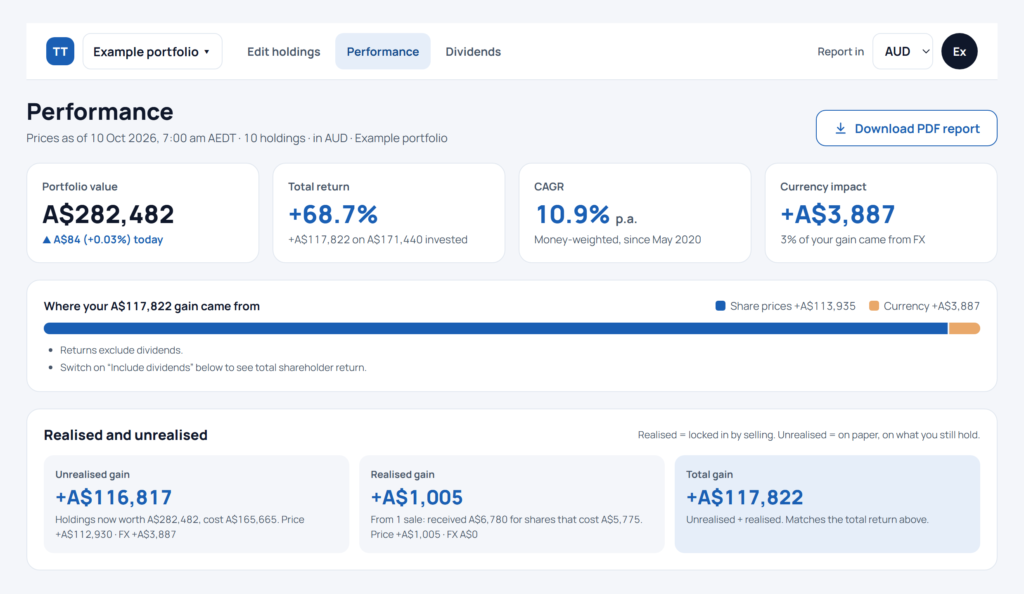
The Performance tab opens with four headline numbers:
| Number | What it tells you |
|---|---|
| Portfolio value | What your holdings are worth today, and today’s change |
| Total return | Your gain as a percentage of everything you’ve invested |
| CAGR | Your average yearly return, so you can compare different time periods fairly |
| Currency impact | How much exchange-rate moves added to or took from your gain |
You can report in any of 10 currencies (AUD, USD, EUR, GBP, JPY, CNY, CAD, CHF, HKD, SGD).
Total return versus CAGR
Total return tells you how much you’ve made overall. CAGR (compound annual growth rate) tells you how fast.
Example: A$10,000 grows to A$16,105 over five years. That’s a 61% total return, but a 10% CAGR, because the growth compounds each year. A 61% return over two years would be far more impressive than the same return over ten.
The tracker’s CAGR is money-weighted: it allows for when you put money in and took it out. Adding a big purchase last month doesn’t distort your long-term rate. how compounding works
Currency impact, explained
If you live in Australia and own US shares, your A$ return depends on two things: the share price and the exchange rate. The tracker splits every gain into from price and from FX.
Example: you buy a US share at US$100 when A$1 buys US$0.65, so it costs you A$153.85. A year later it’s worth US$110, but the Australian dollar has risen to US$0.70.
- From price: +US$10 = +A$14.29
- From currency: −A$10.99 (a stronger dollar makes US assets worth less in A$)
- Your real gain: +A$3.30, only +2.1% in A$, even though the share rose 10%.
For a globally diversified portfolio, this split is one of the most useful things a tracker can show you.
Realised and unrealised gains
Once you’ve sold something, the Realised and unrealised panel shows:
- Unrealised gain: the paper gain on what you still hold.
- Realised gain: the gain you locked in by selling.
- Total: the two together. It always matches the total return above.
Each is split into its price and currency parts.
Step 3: Compare your portfolio with the market
This is the question every investor should ask: would I have done better in an index fund?
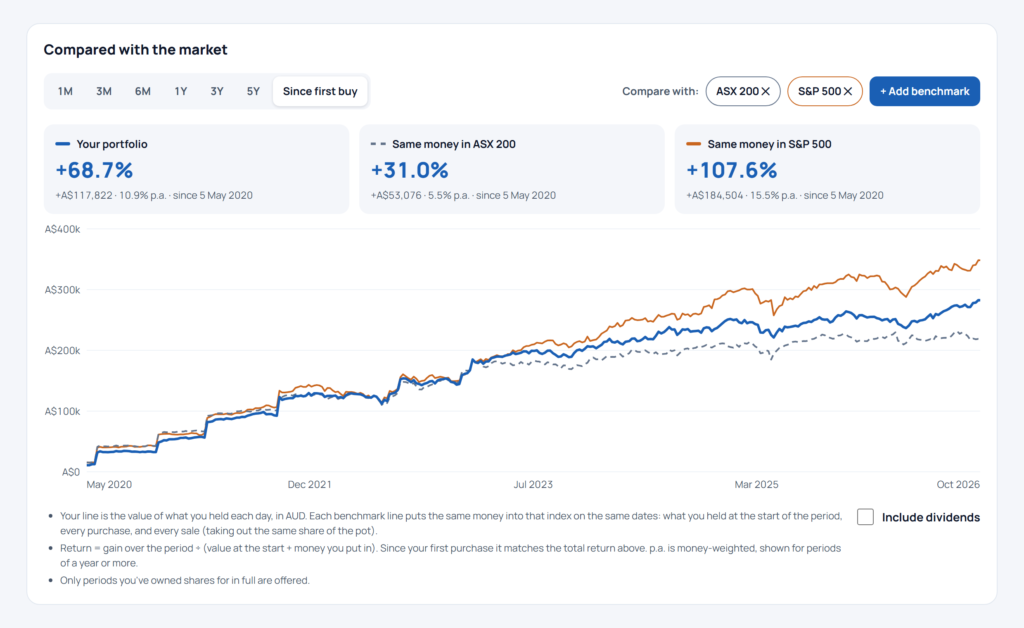
The tracker answers it honestly. It doesn’t use a hypothetical back-test. It takes your actual purchases and sales, on the dates you made them, and works out what the same money would be worth if it had gone into the ASX 200, the S&P 500 or any benchmark you choose.
- Periods: 1M, 3M, 6M, 1Y, 3Y, 5Y and Since first buy. Only periods you’ve owned shares for in full are shown.
- Benchmarks: ASX 200, All Ordinaries, S&P 500, Nasdaq 100, MSCI World, FTSE 100, Nikkei 225, Hang Seng and more. You can also compare with any ETF, such as VGS.AX. Pick up to three.
- Include dividends: switch it on to compare total returns.
- Since first buy matches your headline total return exactly, so the numbers always agree.
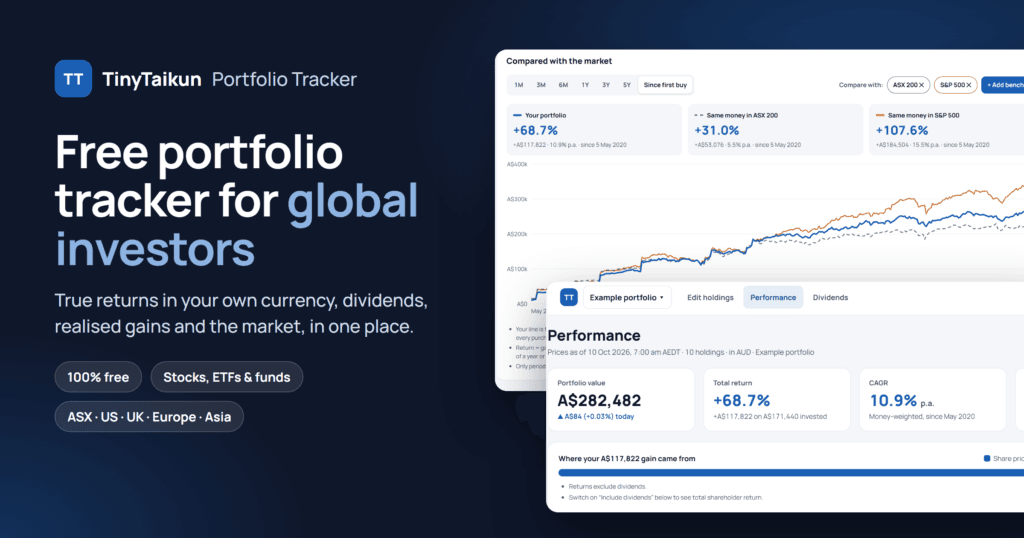
In the example portfolio, the investor’s +68.7% beat the same money in the ASX 200 (+31.0%), but trailed the S&P 500 (+107.6%). That’s a useful prompt to look at why. See how your own portfolio compares.
Step 4: See which holdings are working
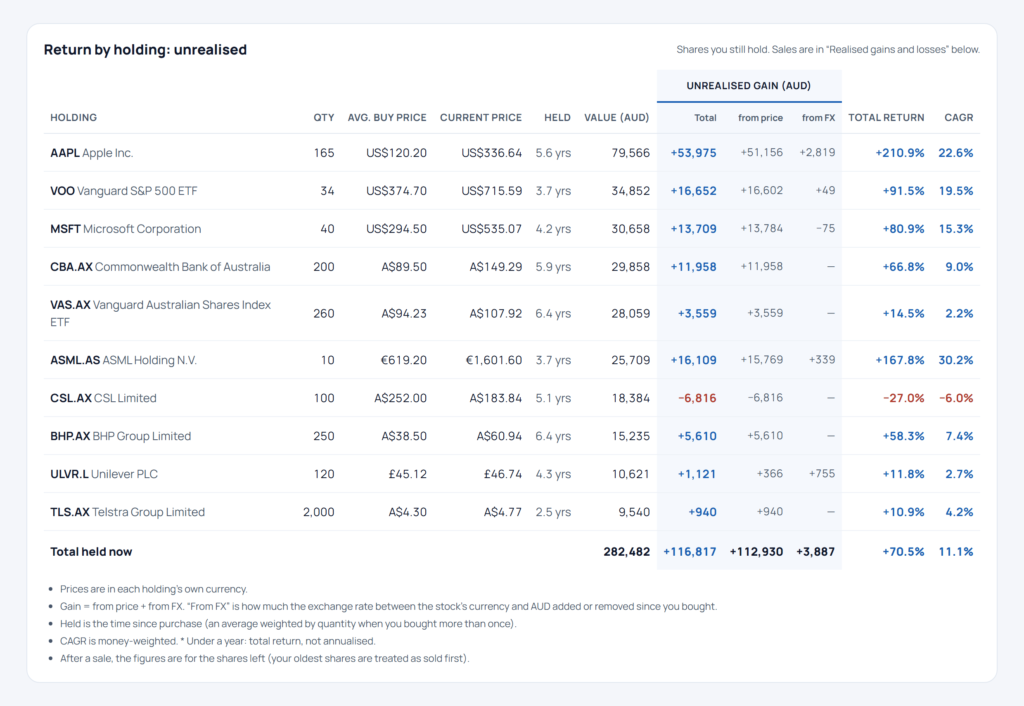
Return by holding lists every position with:
- quantity, average buy price and current price;
- how long you’ve held it (an average if you bought more than once);
- value, gain (from price and from FX), total return and CAGR.
It’s the quickest way to spot your winners, your laggards, and the holdings where currency did the heavy lifting.
Realised gains and losses lists every sale: what you received, what those shares cost you in A$, the realised gain (price and FX), return and CAGR. If you chose which purchase a sale came from, it says so.
Note: this is a portfolio-performance tool, not a tax calculator. Capital gains tax rules (the 50% discount, parcel choice, costs) can give a different figure. See the ATO’s capital gains tax guidance or ask your accountant.
Step 5: X-ray your portfolio
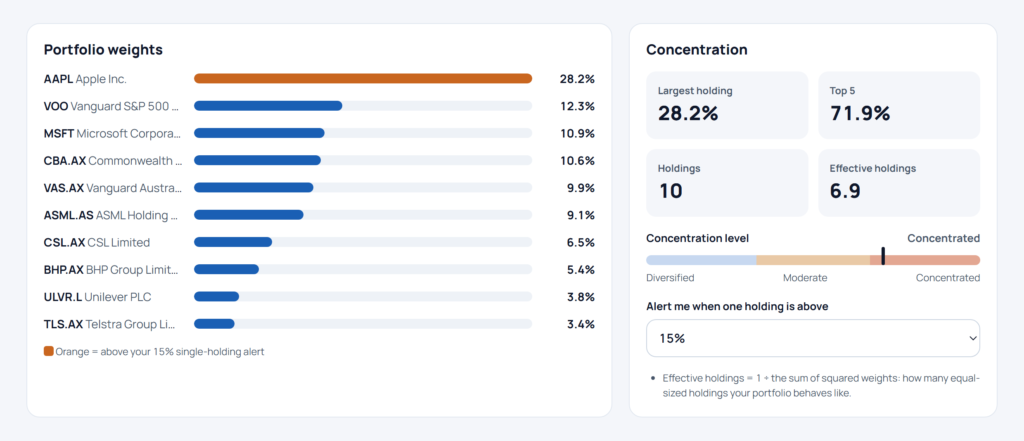
A good return can hide a risky mix. The X-ray shows what you really own.
- Portfolio weights: each holding’s share of your portfolio. Choose an alert level (10, 15, 20 or 25%), and anything above it is highlighted.
- Concentration: your largest holding, your top 5, and your effective number of holdings. Ten shares where one is 40% of the portfolio behave like far fewer than ten. A simple scale shows whether you’re Diversified, Moderate or Concentrated.
- Geography: by country or region, with your home market share (are you too heavily in Australia?).
- Sector: technology, financials, materials and so on. ETFs are shown as their own group.
- Company size: large, mid-size and small companies, by market value.
- Currency and asset type: how much you hold in AUD, USD, EUR and others, and the split between shares and ETFs.
- Insights then summarise what matters in plain English, for example: “Apple is 28.2% of your portfolio, above your 15% alert” or “Technology is your largest sector at 48.1%.”
Step 6: Track your dividends and upcoming results
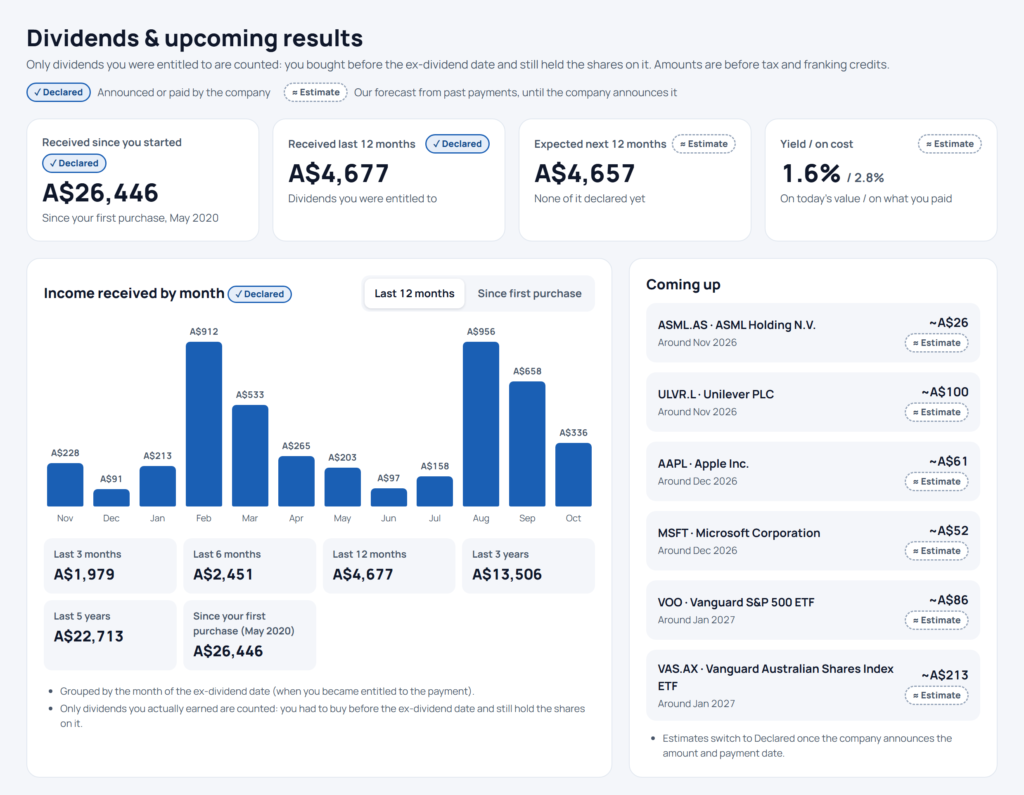
The Dividends tab shows the income your portfolio actually earned.
- Received: since you started and in the last 12 months, plus totals for the last 3 and 6 months and 1, 3 and 5 years.
- Income by month: a chart of dividends by the month you became entitled to them.
- Only real entitlements: a dividend only counts if you bought before the ex-dividend date and still held the shares on it. Buying on the ex-date doesn’t count, just as in real life.
- Coming up: declared dividends (amount and pay date) and estimates based on the past year.
- Expected next 12 months: your forecast income, yield on today’s value, and yield on what you paid.
Amounts are shown before tax and franking credits. value investing basics
Upcoming results shows when the companies you own report earnings over the next six months. Confirmed dates are solid, estimates are dashed, and Add all to my calendar exports them to Outlook, Google or Apple Calendar.
Reports, currencies and more
- PDF report: download a full report with the same look as the website: headline figures, market chart, return tables, X-ray and dividends. Handy for your records or your accountant.
- Reporting currency: switch between 10 currencies and every number updates.
- Several portfolios: keep separate portfolios, for example super, a trading account or a family member’s.
- Export to CSV: download all your purchases and sales at any time. The file uploads straight back in.
Free portfolio tracker: what you get
Everything below is included in the free portfolio tracker, with no paid tier:
| Feature | Included free |
|---|---|
| Stocks, ETFs and funds on global exchanges | ✓ |
| Total return, money-weighted CAGR | ✓ |
| Currency impact (price vs FX split) | ✓ |
| Realised and unrealised gains, choose the parcel sold | ✓ |
| Comparison with the ASX 200, S&P 500, MSCI World or any ETF | ✓ |
| Portfolio X-ray: weights, concentration, geography, sector, size, currency | ✓ |
| Dividend tracker, upcoming results calendar | ✓ |
| CSV/Excel import, CSV export, PDF report | ✓ |
| Guest mode (no sign-up), private by design | ✓ |
FAQs
Is the TinyTaikun portfolio tracker really free?
Yes. There are no fees and no paid tier. Each portfolio holds up to 300 holdings, and you can keep several portfolios.
Can I track ASX and US shares in the same portfolio?
Yes. You can mix the ASX, US, UK, European and Asian markets in one portfolio. Everything is converted into your reporting currency, such as AUD, and the gain is split into price and currency.
How is CAGR calculated?
It’s money-weighted (an internal rate of return). It allows for the timing of each purchase and sale, so new money doesn’t distort your long-term rate. For holdings under a year, the tracker shows the total return instead, because annualising a few weeks would be misleading.
Can I import my holdings from my broker?
Yes. Upload a CSV or Excel export (most work as they are) or use the template. You’ll see a preview, with any problems flagged, before anything is saved.
Is my portfolio data private?
Yes. As a guest, your portfolio stays in your browser. With an account, it’s visible only to you. Only ticker symbols are sent to market-data providers to fetch prices, and you can delete everything at any time.
Start tracking your share portfolio today
When you track your share portfolio properly, it takes minutes and changes how you invest. Once you can see your real return in A$, how much currency helped or hurt, and whether you’re beating the market, your decisions get clearer.
Open the free portfolio tracker → Try it as a guest in under a minute.
Want more tools? Grab our free stock analysis checklist, try our AI stock analysis prompts, or join the TinyTaikun newsletter.
For information and education only. This is not financial or tax advice. Prices may be delayed, and figures in the screenshots come from an example portfolio at the time of writing.
Shop Tiny Taikun Products
‘Notebook of Wisdom’ – Investing Journal with 160 Investor Quotes
Original price was: $99.00.$69.00Current price is: $69.00.
“Invert, Always Invert” Mug – Charlie Munger Quote Coffee Mug
Price range: $36.99 through $42.99AI Stock Research Checklist – 43 Questions with Ready-Made AI Prompts
Original price was: $30.00.$15.00Current price is: $15.00.